15 May 2024
When combining different ingredients to produce balanced diets, the uniformity of mixing is a critical aspect for several reasons (Martins Teixeira et al., 2012):
· Nutritional balance: Ensuring that each portion of food provided to the animals contains the appropriate amount of nutrients relies on the essential aspect of uniform ingredient distribution.
· Prevention of health problems: Lack of uniformity in mixing can lead to ingredient segregation, where certain nutrients or additives may accumulate in specific areas of the batch. This can result in health problems for the animals if they consume portions lacking certain essential nutrients or containing dangerous concentrations of others.
· Intake efficiency: A uniform mixture facilitates more efficient consumption of all necessary nutrients by the animals in each portion of food. This is crucial for maximizing conversion efficiency and minimizing food waste.


·Production costs: Uniform mixing can also have positive economic impacts by reducing variability in food quality. This can help minimize costs associated with animal health issues, performance variability, and food waste.
This is even more important in animals with low consumption rates, such as birds (Loscos, 2016; Rocha et al., 2022).

 The factors that can affect mixing are diverse, including: the type of mixer used, particle size of the ingredients, mixing time, order of ingredient addition, electrostatic charges, type and timing of discharge, among others. Therefore, to achieve a homogeneous mixture, it’s important to use appropriate equipment and follow recommended procedures (Loscos, 2016).
Today, the use of low inclusion rate ingredients such as enzymes, amino acids, vitamins, trace minerals, additives, etc., is common.
| Hence, efficient mixing has become an extremely critical point (Groesbeck et al., 2009).. |
The most common method for assessing mixing quality is the coefficient of variation (CV) (Ãiftci & Ercan, 2003), which is a dimensionless measure of relative dispersion used to compare different distributions. The CV is simply the ratio of the standard deviation to the arithmetic mean.(Kaps & Lamberson, 2004).
![]() However, there remains some discrepancy of opinion regarding what constitutes an appropriate CV value.Â
However, there remains some discrepancy of opinion regarding what constitutes an appropriate CV value.Â
| Regarding mixers, there is a lot of information available about design characteristics and operational efficiency, but there is less focus on “the ability of a compound to be mixed,” known as MIXABILITY. |
Before conducting any analysis, it is essential to establish the process limits (PL).
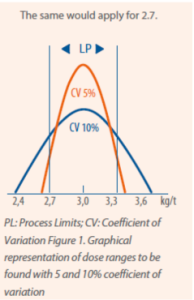
If it’s decided that a variation of ±10% is acceptable, then it’s inferred that values between 2.7 kg and 3.3 kg of the additive per ton of feed are acceptable when sampling from the mixer.
| Referring to the fact that the samples taken should represent the established quantity for the batch size. |
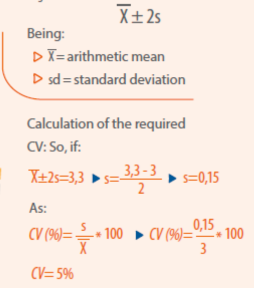
![]() With these PL established, we can now calculate the required CV to achieve.
With these PL established, we can now calculate the required CV to achieve.
- Producto X: dosage 3 kg/t AB ±10% => minimum 2.7 kg/t and maximum 3.3 kg/t.
- Condition: To be met 95% of the time, which, according to the standardized Gaussian table, equates to the following:


If the same analysis were conducted for a CV=10%, it would be observed that the results fall outside the established limits, as shown in Figure 1.
To conduct mixing tests, an analyzable marker or tracer is used in the feed (microtracers) (Ãiftci & Ercan, 2003; Rocha et al., 2015).
To select a good tracer, the following criteria should be considered (Barashkov et al., 2007):
- It should represent a significant amount of what is being measured.
- There should be an analytical procedure to determine the tracer accurately.
- The analytical procedure should be economical and rapid.
- It should allow for the interpretation of results objectively.
One opinion from this author is that whenever feasible, using more than one tracer is advisable, which is useful for two reasons:
| Depending on the hectoliter weight (hl) of the tracer, the result could represent more closely those components with a similar hectoliter weight. |
| It also serves to confirm the results found with the other tracer. |
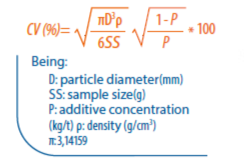
On the other hand, the ability of a tracer, as well as some of the additives in the formulas to be homogeneously mixed, can be feasibly calculated with the following formula (adapted from Bunzel, 2008):

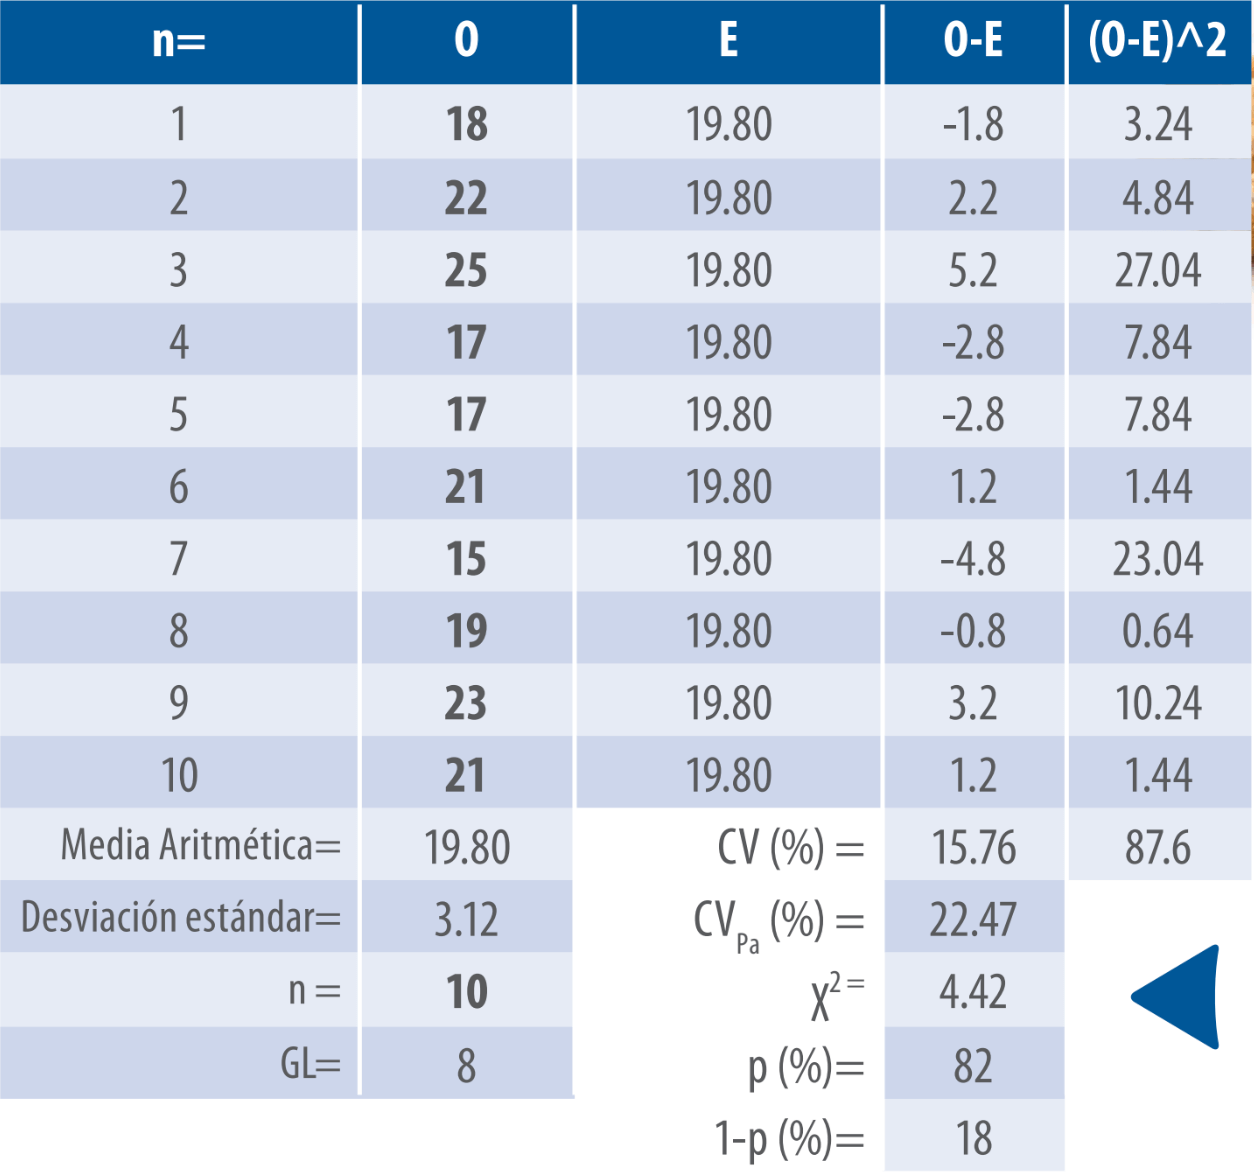
| It happens that, even when these conditions are met, sometimes the CV is not good due to a statistical reason: the ten samples commonly taken for the calculation, being few, do not follow a normal distribution. In such cases, probability distributions for small samples such as the Poisson distribution, Chi-square distribution, and also the calculation of p probability can be used. |
![]() Chi-square (Ï2) tests whether the differences between observed and expected values are significant, and p expresses the probability concerning the value of Ï2 found, as shown in the following example.
Chi-square (Ï2) tests whether the differences between observed and expected values are significant, and p expresses the probability concerning the value of Ï2 found, as shown in the following example.

| It is also important to define the size of the samples to be taken from the mixer for analysis because it affects the CV. The requirement for a specific mixing quality is not the same for a bird consuming 50 or 100 g of feed as it is for a steer or a dairy cow consuming 5 or 10 kg of feed. |
|
In summary, the first step is to determine the process limits, then establish the sample size, and finally calculate the required CV using the mentioned formula. |
Barashkov N, Eisenberg D, Eisenberg S & Mohnke J. 2007. Ferromagnetic microtracers and their use in feed applications. In XII International Feed Technology Symposium. Novi Sad, Serbia. 12-15 November.
Bunzel D. 2008. Theory and practice of dosing and mixing of amino acids. AMINONews, 11(2): Special Edition.
Ãiftci Ä° & Ercan A. 2003. Effects of diets of different mixing homogeneity on performance and carcass traits of broilers. Journal of Animal and Feed Sciences, 12(1): 163-71.
Groesbeck CN, Goodband RD, Tokach MD, Dritz SS, Nelssen JL & DeRouchey JM. 2009. Diet mixing time affects nursery pig performance. Journal of Animal Science, 85(7): 1793-98.
Kaps M & Lamberson WR. 2004. Biostatistics for Animal Science. Wallingford, Oxfordshire, UK: CABI Publishing. 445 pp.
Loscos J. 2016. Feed homogeneity: A key factor in animal nutrition. NutriNews, (May/June): 7-13.
Martins Teixeira M, Rizzo R, Detmann E, Gomes Moreira RM & Shigueaki Sassaki R. 2012. Evaluation of the quality of feed mixing in a horizontal mixer considering ingredient homogeneity. Enciclopedia Biosfera, 8(14): 123-31.
Rocha AG, Dilkin P, Montanhini RN, Schaefer C & Mallmann CA. 2022. Growth performance of broiler chickens fed on feeds with varying mixing homogeneity. Veterinary and Animal Science, 17: 100263.
Rocha AG, Montanhini RN, Dilkin P, Tamiasso CD & Mallmann CA. 2015. Comparison of different indicators for the evaluation of feed mixing efficiency. Animal Feed Science and Technology, 209: 249-56.
